Cash from Trash: Renewable Natural Gas
Published on April 3, 2024
Innovation and growth may not be the first words that come to investors’ minds when thinking about the waste management industry, but they should be.
Producing Cash from Trash: Renewable Natural Gas
Landfills often have a terrible reputation: smelly, polluting, and harmful to the planet. In reality, however, waste companies have proven to be strategic innovators as the regulatory framework in the U.S. has dramatically tightened over the past several decades, leading to stringent monitoring and containment practices that limit contaminants and control the siting of landfills. Recycling and composting have also expanded to account for roughly a third of the U.S. waste stream. Recent actions to ramp up production of renewable natural gas — whereby landfill owners convert landfill gas emitted by decaying landfill waste into a low-emission fuel for utilities and vehicles — further enhances the long-term sustainability of landfills while also creating a high margin, high return on capital revenue stream.
The (Strengthening) Case for Waste
We have written in the past about how attractive the North American waste industry is from an investing standpoint. Significant regulatory barriers to entry, stable demand, durable pricing power, and continued opportunity for tuck-in acquisitions have enabled prodigious and growing free cash flow generation with improving returns on capital. We think this healthy dynamic should persist for the foreseeable future.
Further enhancing the investment case for waste is an emerging opportunity to capture a high margin revenue stream that can also help reduce greenhouse gas emissions: renewable natural gas (RNG).
How RNG is Produced
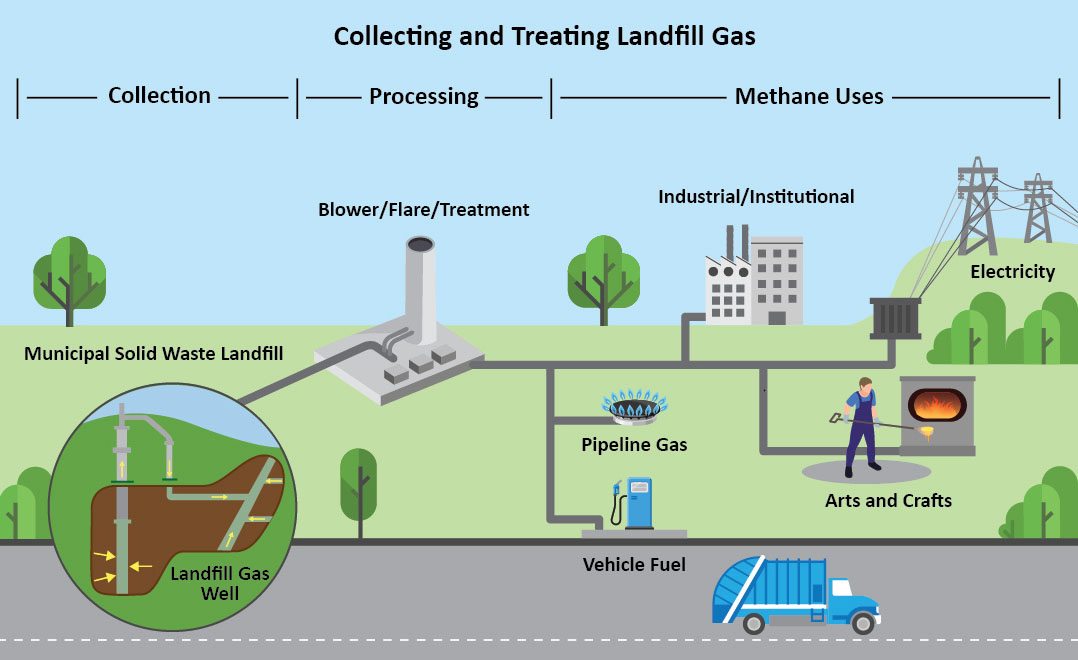
Decaying municipal solid waste (i.e., garbage) in landfills generates copious amounts of harmful gases (landfill gas) comprised primarily of methane and carbon dioxide, in addition to other noxious particles. In the U.S., landfills are the third largest source of human-related methane emissions. Methane is a particularly potent greenhouse gas that traps heat in the atmosphere at 28x the rate of carbon dioxide; landfill gas can also cause unpleasant odors.
The Clean Air Act requires landfills above a certain size to build and maintain infrastructure to collect, monitor, and flare landfill gas. Flaring landfill gas typically destroys over 99% of the methane, thereby largely offsetting the most environmentally harmful component of landfill gas and neutralizing related odors.
However, rather than simply flaring the landfill gas, landfills can leverage their existing gas collection infrastructure, process it into RNG that removes the most pollutant elements of the gas through thermochemical processes like gasification, and sell the gas for use in vehicles and electric utilities. The resulting RNG is chemically identical to conventional natural gas and can be used in existing natural gas distribution networks.
Environmental Benefits of RNG
While flaring landfill gas significantly reduces the environmental harm of landfills, it may not seem obvious that processing the landfill gas into RNG has positive environmental ramifications. However, the impacts are meaningful.
RNG projects capture up to 90% of the methane emitted from landfills, depending on system design and effectiveness. The captured methane is destroyed (converted to water and the much less potent carbon dioxide) when the gas is burned to produce energy. And the use of RNG can help replace highly polluting fossil fuels like coal in electric utilities and diesel in trucks.
Economic Benefits of RNG
RNG qualifies as an advanced biofuel under the EPA’s Renewable Fuel Standard, which requires renewable fuel to be blended into transportation fuel in increasing amounts each year. This helps ensure sustained growth in demand for RNG and bolsters the market for related tax credits.
In the case of Waste Connections, the third largest waste management company in North America and a longtime holding in our core equity and income strategies, the company plans to deploy roughly $200 million of aggregate capital on RNG facilities through 2025. Waste Connections' management anticipates having roughly 12 RNG facilities in operation across its landfill portfolio generating as much as $200 million in pre-tax cash flow by 2026. As a result, management expects a very rapid payback of 2-3 years. Regulatory changes to the Renewable Fuel Standard could impact the price of RNG, so Waste Connections is taking various measures to hedge price volatility.
Importantly, capturing and processing landfill gas into RNG should help Waste Connections achieve two of its key ESG goals of driving a 40% increase in biogas recovery and achieving a 15% reduction in scope 1 and scope 2 emissions by 2035.
Benefits to the Environment and the Bottom Line
By processing landfill gas, companies like Waste Connections are helping reduce the impact of municipal solid waste (garbage) on the environment. Importantly, we believe the financial profile of RNG projects appears highly attractive, with significant cash flow generation and rapid payback. As a result, RNG should help make landfills more environmentally and financially sustainable long into the future.
Nael Fakhry
Co-Chief Investment Officer – Core Equity
Core Equity Composite (as of 3/31/26)
In our Core Equity accounts Osterweis has the discretion to decrease or increase equity exposure in an effort to reduce risk.
| QTD | YTD | 1 YR | 3 YR | 5 YR | 7 YR | 10 YR | 15 YR | 20 YR | INCEP (1/1/1993) |
||
|---|---|---|---|---|---|---|---|---|---|---|---|
| Core Equity Composite (gross) | -4.43% | -4.43% | 11.51% | 12.57% | 6.48% | 10.82% | 10.62% | 9.58% | 8.78% | 11.15% | |
| Core Equity Composite (net) | -4.66 | -4.66 | 10.44 | 11.48 | 5.45 | 9.74 | 9.54 | 8.50 | 7.70 | 10.00 | |
| S&P 500 Index | -4.33 | -4.33 | 17.80 | 18.32 | 12.06 | 14.44 | 14.16 | 13.29 | 10.53 | 10.57 | |
Past performance does not guarantee future results.
Rates of return for periods greater than one year are annualized. The information given for these composites is historic and should not be taken as an indication of future performance. Performance returns are presented both before and after the deduction of advisory fees. Account returns are calculated using a time-weighted return method. Account returns reflect the reinvestment of dividends and other income and the deduction of brokerage fees and other commissions, if any, but do not reflect the deduction of certain other expenses such as custodial fees. Monthly composite returns are calculated by weighting account returns by beginning market value. Net returns reflect the deduction of actual advisory fees, which may vary between accounts due to portfolio size, client type, or other factors. From 1/1/2021 onward, net returns also reflect mutual fund fee waivers in certain periods.
The S&P 500 Index is widely regarded as the standard for measuring large cap U.S. stock market performance. The index does not incur expenses, is not available for investment, and includes the reinvestment of dividends. The S&P 500 Index data are provided for comparison of the composite’s performance to the performance of the stock market in general. The S&P 500 Index performance is not, however, directly comparable to the composites’ performance because accounts in the composites generally invest by using a portfolio of 30-40 stocks and the S&P 500 Index is an unmanaged index that is widely regarded as the standard for measuring U.S. stock market performance.
The fee schedule is as follows: 1.25% on the first $10 million, 1.00% on the next $15 million up to $25 million, and 0.75% in excess of $25 million. A discounted, institutional rate is available.
Clients invested in separately managed core equity accounts are subject to various risks including potential loss of principal, general market risk, small and medium-sized company risk, foreign securities and emerging markets risk and default risk. For a complete discussion of the risks involved, please see our Form ADV Brochure and refer to Item 8.
The Core Equity Composite includes all fee-paying separately managed accounts that are predominantly invested in equity securities, and for which OCM has the discretion to increase and decrease equity exposure in an effort to reduce risk. The non-equity portion of the account may be invested in cash equivalents, fixed income securities, or mutual funds. Individual account performance will vary from the composite performance due to differences in individual holdings, cash flows, etc.
References to specific companies, market sectors, or investment themes herein do not constitute recommendations to buy or sell any particular securities.
There can be no assurance that any specific security, strategy, or product referenced directly or indirectly in this commentary will be profitable in the future or suitable for your financial circumstances. Due to various factors, including changes to market conditions and/or applicable laws, this content may no longer reflect our current advice or opinion. You should not assume any discussion or information contained herein serves as the receipt of, or as a substitute for, personalized investment advice from Osterweis Capital Management.
Holdings and sector allocations may change at any time due to ongoing portfolio management. You can view complete holdings for a representative account for the Osterweis Core Equity strategy as of the most recent quarter end here.
Opinions expressed are those of the author, are subject to change at any time, are not guaranteed, and should not be considered investment advice.
Cash flow measures the cash generating capability of a company by adding non-cash charges (e.g. depreciation) and interest expense to pretax income.