In Search of Upside: Finding Opportunities in Small Cap Growth
Published on January 5, 2022
Small cap growth stocks lagged for most of 2021 as the market simultaneously dealt with the pandemic, inflation, and tightening Fed policy. Given these challenges, we have been focusing on high quality companies trading at attractive valuations, and we have also been looking at non-technology businesses that are embracing digitization.
Although the worst of Covid-19 has hopefully passed, its impact on the markets remains front and center. The pandemic has been wreaking havoc on the economy for nearly two years, resulting in rising inflation and potentially higher interest rates, and it appears increased market volatility may continue in the near term as investors sort out the effects of new variants.
As a result, we have increased our focus on high quality companies trading at attractive prices, as we believe they are more likely to outperform even in challenging environments. Additionally, we have been looking at non-technology businesses that are successfully participating in the digital revolution, as we believe the market does not fully recognize their potential.
Small Caps Marked Time In 2021
As the below chart shows, small cap growth stocks began 2021 on the heels of an historic bull run, which largely explains their tepid performance last year.
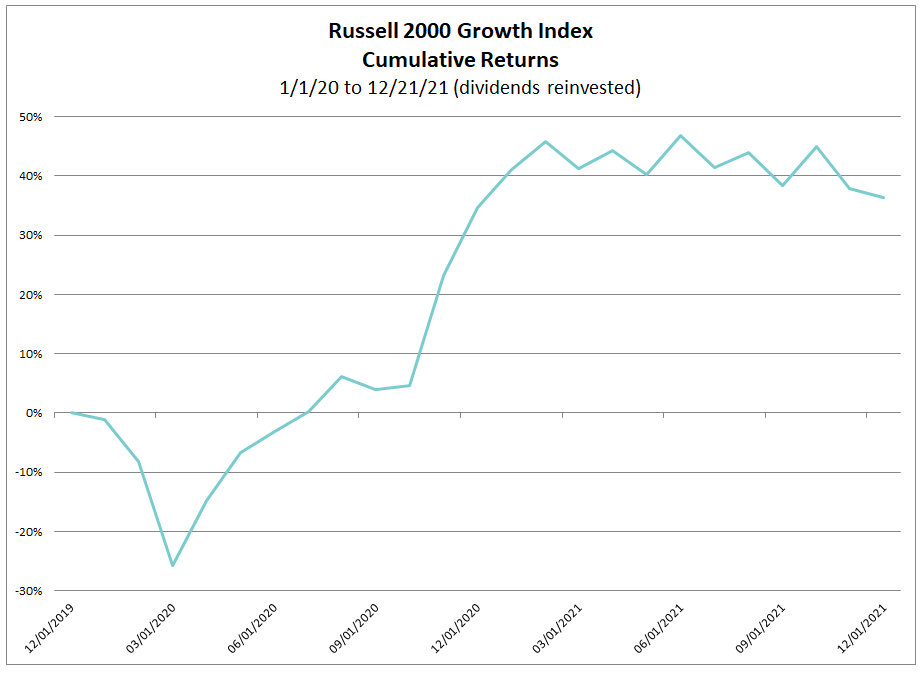
Source: RIMES
The rally eventually lost steam in February, as investors were confronted by multiple economic headwinds, including continuing Covid issues, rising inflation, supply chain disruptions, labor shortages, and shifting Fed policy. Given the uncertain backdrop and elevated share prices, sentiment never recovered in 2021, resulting in a sawtooth pattern of fits and starts for the entire year.
Nonetheless, the valuations of many small cap growth companies were slow to revert to attractive levels, despite their lackluster performance. For example, as you can see in the chart below, price/sales ratios for the SaaS industry skyrocketed during the pandemic and did not begin to fall until the end of the year. In 2015, average SaaS revenue multiples were as low as 3.6x, vs. a peak of 20.7x in 2021!
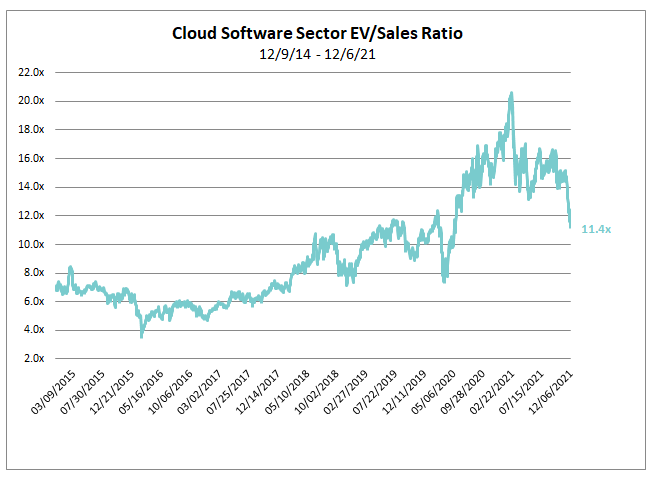
Source: Piper|Sandler
Although they are still above pre-pandemic levels, it appears the sector is beginning to rationalize as valuations have finally started to approach their historical norms. Periods of valuation rationalization combined with secular growth potential often create compelling buying opportunities.
Focusing On Quality At Attractive Valuations
With prices elevated for most of 2021, we were laser-focused on buying quality companies at attractive valuations. Of course, we always seek to invest in high quality businesses, but with the Fed expected to increase interest rates next year, it is vital that companies demonstrate their business models are durable and that their share prices are supported by fundamentals.
One area we have been emphasizing is profitability – surprisingly, over 40% of companies in the Russell 2000 Growth index are not profitable. We focus on profitability as a quality indicator because companies which can self-fund their growth are less exposed to the whims of capital markets or equity dilution. Additionally, profitable companies tend to have healthy cashflows, which make them more likely to weather short-term swings in the economy and less sensitive to changes in interest rates.
Beyond financials, we feel there are two other important measures of quality. First, we always look for companies with competitive advantages that are differentiated in their space, and second, we seek firms that are well-positioned within markets that are expanding. Companies with strong advantages that operate in shrinking markets will have trouble sustaining high growth rates despite their leadership position. Likewise, firms that are able to take advantage of strong secular growth trends have inherent advantages, but if their product is easily replicated they will have trouble increasing market share.
Examples of high quality, attractively valued firms currently in our portfolio include:
- Onto Innovation: Onto sells critical semiconductor capital equipment used in process control and advanced packaging. Its process control equipment is critical to minimizing defects and boosting yields in the semiconductor manufacturing process which powers the building blocks of our increasingly digitized economy via cloud computing, e-commerce, and the proliferation of semiconductors across the economy, including in autos and the internet of things. Onto’s profitability is impressive, with operating margins approaching 30%. Furthermore, the stock trades at an undemanding multiple of 21x consensus 2022 earnings. The company is well on its way towards reaching its $1 billion revenue model, with more than $5 in earnings per share and we believe there is upside beyond this as well.
- MaxLinear: MaxLinear is a semiconductor company that primarily serves the broadband and connectivity markets, where it sells chips that go into modems, gateways, and routers, enabling consumers to connect to the internet via cable and fiber networks. This market has favorable, duopolistic competitive dynamics and a strong, multiyear growth outlook due to increasing investment from cable and fiber operators. We are also excited by MaxLinear’s emerging infrastructure segment, which is projected to grow more than 50% this year, serving secular growth markets like cloud data centers, with Amazon as its first customer. The company’s operating margins are approaching 30% and yet it trades at an attractive price-to-earnings multiple of 21x 2022 earnings.
For both Onto and MaxLinear, we like the combination of high quality as evidenced by strong operating margins and attractive valuations. We believe moving out of software (trading at 20x sales) and into semiconductors (trading at 20x earnings), gives us exposure to secular growth trends, but at much more attractive prices.
Embracing Digital Transformation
In addition, we have been looking for opportunities with non-technology companies that are using technology to reinvent themselves. These types of firms have always been of interest to us, but they are particularly attractive right now as they generally do not command the same lofty valuations as true software companies but can offer similar upside. They generally outperform their competitors by creatively deploying technology to decrease their operating costs and/or increase their revenues.
A classic example is Domino’s Pizza. When Patrick Doyle became CEO in 2010, he was determined to deliver a better customer experience. This included not just improving the quality of the pizza, but also upgrading their online presence. Domino’s created innovative apps with popular features, including one that lets customers track the progress of their order. The combination of high quality pizza and customer-friendly software powered the company to become America’s biggest pizza chain, and its stock price has risen by more than 10x since 2012, outperforming Apple and Google!
Two examples of innovative companies outside the technology sector following a similar approach are:
- Wingstop: Wingstop is an international restaurant chain specializing in chicken wings, fries, and sides. The company is primarily a take-out business, so it has fared remarkably well during the pandemic. While many of their competitors have been struggling with the decline in in-person dining, their business has been booming – largely due to their substantial digital presence. 65% of the company’s total sales currently come through online channels (which carry a $5 higher check on average) versus just 35% pre-Covid. With over 1,500 restaurants worldwide and a skilled management team, we believe the company has plenty of runway for additional growth.
- Floor & Decor: Floor & Decor is a nationwide retailer offering a broad assortment of in-stock hard-surface flooring, including tile, wood, laminate, vinyl, and natural stone. The company operates similarly to Home Depot – each location is a warehouse-sized showroom, except that the entire space is dedicated to flooring and related accessories. Business has been strong during the pandemic, particularly for online sales, which have increased from 10% of total revenues pre-Covid to 15% currently. The company provides a rich online shopping experience that has been particularly helpful for customers looking to avoid in-person shopping, and we expect it will continue to drive business in the future as consumers get more comfortable making large purchases online.
Final Thoughts
Covid-19 is a once-in-a-generation event that continues to impact the financial markets as much as it impacts our daily lives. With more uncertainty likely in the near term, including inflation and potentially higher interest rates, we think the best approach is for small cap growth investors to focus on the highest quality businesses at attractive valuations, including companies that are embracing digital transformation in traditional areas of the economy.
Small Cap Growth Composite (as of 3/31/26)
| QTD | YTD | 1 YR | 3 YR | 5 YR | 7 YR | 10 YR | 15 YR | INCEP (7/1/2006) |
||
|---|---|---|---|---|---|---|---|---|---|---|
| Small Cap Growth Composite (gross) | -3.59% | -3.59% | 14.60% | 11.27% | 1.64% | 11.66% | 14.87% | 13.89% | 13.41% | |
| Small Cap Growth Composite (net) | -3.82 | -3.82 | 13.55 | 10.23 | 0.69 | 10.62 | 13.78 | 12.79 | 12.31 | |
| Russell 2000 Growth Index | -2.81 | -2.81 | 23.58 | 12.27 | 1.62 | 7.68 | 9.79 | 9.09 | 8.39 | |
Past performance does not guarantee future results.
Rates of return for periods greater than one year are annualized. The information given for this composite is historic and should not be taken as an indication of future performance. Performance returns are presented both before and after the deduction of advisory fees. Portfolio returns are calculated using a time-weighted return method. Portfolio returns reflect the reinvestment of dividends and other income and the deduction of brokerage fees, other commissions if any, and foreign withholding taxes. For the period 10/1/2012-12/31/2015, gross and net portfolio returns reflect the deduction of custodial, administrative, audit, legal, operating, and other expenses. Composite returns are calculated monthly by weighting portfolio returns by the beginning market value. Net return calculation:
A. For the period 7/1/2006-3/31/2014, composite net returns reflect the monthly deduction of an annual model advisory fee of 1.00%:
A1. For the period 7/1/2006-9/30/2012, one or more accounts paid a fee higher than the 1.00% model fee. During this period, the composite net return using the model fee of 1.00% was 10.95%. The composite net return using actual fees paid was 10.61%.
A2. For the period 10/1/2012-3/31/2014, no account in the composite paid a fee higher than the 1.00% model fee.
C. From 1/1/2020 onward, the composite net return is calculated using actual advisory fees, including any applicable mutual fund fee waivers.
D. Our fees may vary between accounts due to portfolio size, client type, or other factors.
Performance for the periods 7/1/2006-9/30/2012 and 10/1/2012-3/31/2016 represents the results of portfolios managed by the investment team while at RS Investment Management Co. LLC and Callinan Asset Management LLC, respectively, and employing the same investment strategy being used at OCM.
The Russell 2000 Growth Index (Russell 2000G) is a market-capitalization-weighted index representing the small cap growth segment of U.S. equities.
Clients invested in separately managed emerging growth accounts are subject to various risks including potential loss of principal, general market risk, small and medium-sized company risk, foreign securities and emerging markets risk and default risk. For a complete discussion of the risks involved, please see our Form ADV Brochure and refer to Item 8.
The Small Cap Growth Composite includes all fee-paying separately managed accounts, limited partnerships, and mutual funds that are predominantly invested in a concentrated selection of the equity securities of small and medium capitalization companies that can rapidly grow revenues and earnings. Portfolios normally remain primarily invested in equity securities except in times of unusual market stress when a more defensive allocation may be deemed prudent. The non-equity portion may be invested in holdings such as cash, cash equivalents, short-term debt securities, mutual funds, and ETFs. The benchmark is the Russell 2000® Growth Index.
References to specific companies, market sectors, or investment themes herein do not constitute recommendations to buy or sell any particular securities.
There can be no assurance that any specific security, strategy, or product referenced directly or indirectly in this commentary will be profitable in the future or suitable for your financial circumstances. Due to various factors, including changes to market conditions and/or applicable laws, this content may no longer reflect our current advice or opinion. You should not assume any discussion or information contained herein serves as the receipt of, or as a substitute for, personalized investment advice from Osterweis Capital Management.
Holdings and sector allocations may change at any time due to ongoing portfolio management. You can view complete holdings for a representative account for the Osterweis Small Cap Growth strategy as of the most recent quarter end here.
Opinions expressed are those of the author, are subject to change at any time, are not guaranteed and should not be considered investment advice.
The S&P 500 Index is an unmanaged index that is widely regarded as the standard for measuring large-cap U.S. stock market performance.
The Russell 2000 Growth Index is a market capitalization weighted index representing those stocks within the approximately 2000 smallest companies in the universe of U.S. equities that exhibit growth characteristics.
The Russell 2000 Index is an index measuring the performance of the 2,000 smallest companies in the Russell 3000 Index.
Cash flow measures the cash generating capability of a company by adding non-cash charges (e.g. depreciation) and interest expense to pretax income.
Price-to-Sales (P/S) ratio is calculated by taking a company’s market capitalization (the number of outstanding shares multiplied by the share price) and dividing it by the company’s total sales or revenue over the past 12 months.
Price-to-Earnings (P/E) multiple is Price-to-Earnings (P/E) ratio is the ratio of the stock price to the trailing 12 months diluted EPS.
Earnings per share (EPS) is the portion of a company’s profit allocated to each outstanding share of common stock.