Are Investors Walking a Tightrope with the Mag 7?
Published on April 8, 2024
Over the past several years, investors have been rewarded by investing in the Magnificent 7-dominated S&P 500. Perhaps they should consider a different approach going forward.
Time to Reevaluate Your Equity Allocation
As the S&P 500 has become an unprecedentedly narrow index in recent years, investors face a dilemma: Should they sit tight with this top-heavy index, or should they shift allocations?
While the S&P 500 comprises a broad set of companies, we think that taking a high conviction, highly selective approach focused on both Quality Growth mid and large cap companies as well as higher growth and more innovative Emerging Growth small cap companies could reward investors as the market likely broadens.
S&P 500 In Context
The S&P 500 includes 500 leading U.S. companies and covers roughly 80% of the U.S. market capitalization of public equities. Its diversification and quality factors have historically made it a standard for core equity allocation.
However, the current level of narrowness in the S&P 500 is at unprecedented levels. According to Reuters, “concentration within the U.S. equity market has not been this high in decades, with the 10 largest U.S. stocks now accounting for 33% of S&P 500 market cap. A narrower measure constructed by analysts at Goldman Sachs shows that market concentration has never been higher."1
The Magnificent 7 (Apple, Amazon, Alphabet, Meta, Microsoft, Nvidia, and Tesla) alone comprise nearly 30% of the S&P 500 market capitalization. As we have written in the past, the Magnificent 7 in aggregate represent a strong set of businesses, so the concentration is not completely without merit. In fact, from a growth, profitability, and balance sheet perspective, the Magnificent 7 far outshine the broader S&P 500. Given these fundamentals, the valuation premium of the Magnificent 7 does not appear unreasonable in aggregate. However, some members of the Magnificent 7 trade at extremely high valuations, especially relative to stagnating profitability, growth, and returns on capital. Ultimately, valuation must reflect fundamentals.
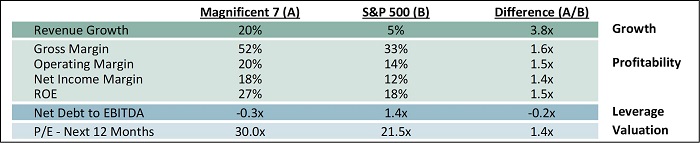
Note that revenue growth is projected for 2024 vs. 2023 actual results, while margins/ROE/net debt to EBITDA reflect 2023 actual results.
Source: Bloomberg (as of 3/14/2024).
Perhaps, more importantly than valuation as a risk, competitive threats and execution issues could dethrone one or more of the companies that are so important to the index today. Just ten years ago the top ten companies in the S&P 500 included Chevron and Wells Fargo, neither of which is even in the top 20 today. And 20 years ago, Pfizer, Citigroup, GE, Intel, Cisco, and IBM counted among the top ten companies of the S&P 500. Not one of those is in the top 20 today.
Furthermore, a recent study by Goldman Sachs2 found that buying and holding the top ten stocks in the S&P 500 generally produced negative relative returns vs. the S&P 500. Since 1980, these top ten stocks underperformed the S&P 500 by -2.0% and -2.3% annualized over the next three and five years, respectively. While the top ten companies are dominant, “faster companies come along and outperform … innovation tends to generate new technologies, products and markets; alongside these, stock market leadership also tends to change.”
As a result, the market broadens out over time, as valuation and fundamentals balance one another out. But in the short term, as reflected in the current top-heavy S&P 500, market returns can be highly concentrated.
Consider that over the past five years, the market cap-weighted S&P 500 has generated an annualized total return of roughly 15% vs. 12% for the S&P 500 Equal Weight Index. However, over longer periods of time, the market cap-weighted and equal weighted S&P 500 have generated roughly equivalent returns. If history is any guide, future returns should broaden beyond the largest components of the S&P 500 of today.
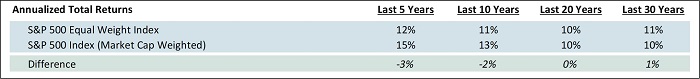
Source: RIMES as of 3/14/2024. Past performance does not guarantee future results.
Small Caps in Context
Historically, there has been a strong small cap premium, with small cap stocks outperforming large caps over long periods going back to 1926.
The outperformance of small caps could be explained by relatively lower market liquidity, better fundamental growth, and a higher risk premium. However, over the past five to ten years, small caps have underperformed large caps, coinciding with the rise of the Magnificent 7.
As a result, small caps now look undervalued vs. large caps on several measures, especially when considering a more stable interest rate environment. For example, an analysis by Jefferies found that small caps are now just 4% of the total U.S. equity market vs. previous highs approaching nearly 15%. This relative undervaluation for small caps at less than 5% of the market has historically been a catalyst for strong forward returns, with small caps outpacing large caps by 11.7%, 8.1%, and 7.7% over subsequent one-, three-, and five-year periods.
Where to From Here? A Two-Part Solution: Quality Growth and Emerging Growth Companies
We think that a high conviction portfolio of carefully selected Quality Growth mid and large cap companies purchased at attractive valuations can generate attractive future returns with the opportunity for better downside protection compared to the S&P 500. We also believe that owning a high conviction portfolio of Emerging Growth small cap companies that are fast-growing, highly innovative, and largely undiscovered could add further upside. These strategies should generate attractive returns in their own right but also broaden equity exposure beyond the top-heavy S&P 500.
Core Equity: A Quality Growth Approach to Mid/Large Cap Exposure
As Warren Buffett wrote in his 2023 annual letter to Berkshire shareholders, his success has been largely driven by owning “wonderful businesses purchased at fair prices.” Consistent with this view, we believe that owning a well-curated portfolio of Quality Growth companies purchased at attractive valuations should generate compelling returns over time, as strong business fundamentals — growing free cash flow per share with high and/or improving returns on capital — should be reflected in rising share prices and growing dividends. We define Quality Growth companies as excellent businesses with durable competitive advantages that have long runways for growth and strong management teams. Discipline around valuation is key because buying at attractive valuations can enable multiple expansion, further driving upside in returns.
We take a long-term view, typically underwriting returns over a three- to five-year holding period, but we have owned some companies for over a decade. Taking a long-term view allows excellent businesses to generate differentiated returns over time while also maximizing the opportunity to generate long-term rather than short-term capital gains (taxes on the former are far less costly than on the latter).
Our Core Equity portfolio is composed of 30-40 carefully selected Quality Growth mid and large cap companies, including some members of the Magnificent 7, that we purchased at attractive valuations and that we believe can deliver attractive returns over time.
Emerging Growth: A Valuation Sensitive Approach to Small Cap Growth Exposure
A distinguishing characteristic of the small cap universe is that it contains some of the youngest and most innovative public companies. As a result, these companies tend to be more disruptors than disrupted. Household names such as Netflix, Amazon, and Nvidia all started out as small caps. Our Emerging Growth strategy has owned several companies like these, well before they became mega cap behemoths. By constantly sifting through the small cap universe, we hope to identify the next set of transformational winners well before the broader market discovers them.
Our Emerging Growth strategy is singularly focused on identifying exceptional companies that have the potential to “graduate” to mid and large cap companies. Such businesses often benefit from two kinds of growth tailwinds: 1) strong innovation, which leads to growing market share/penetration and 2) secular market growth.
We believe that our sustained success investing in small caps can be attributed to four differentiators:
- Our consistent focus on smaller, emerging companies, including our immersion in the San Francisco/Bay Area innovation ecosystem
- Leveraging our experience
- Staying disciplined in terms of valuation
- Investing only in our best ideas – 30 to 40 holdings
We believe both the intrinsic innovation characteristics in small caps and the current undervaluation relative to large caps make this a particularly opportune time to consider diversifying S&P-oriented exposure with small cap growth. Moreover, our four key differentiators have helped us generate consistently strong returns over time.
Conclusion
It is prudent for investors to consider diversifying away from an increasingly concentrated S&P 500. While the leaders of today are excellent companies in aggregate, valuation and competitive threats are concerns not to be ignored. History tells us that returns are likely to broaden, with the current level of market concentration unlikely to persist over time.
We think that shifting equity allocations to both Quality Growth mid and large cap companies as well as higher growth and more innovative Emerging Growth small cap companies could reward investors as the market likely broadens.
1Jamie McGeever, Reuters, “Peak US stock concentration doesn't mean steep drawdown, March 13, 2024”
2Peter Oppenheimer and others, Goldman Sachs, “The Concentration Conundrum; What to do about market dominance”
Nael Fakhry
Co-Chief Investment Officer – Core Equity
Bryan Wong, CFA
Vice President & Portfolio Manager - Small Cap Growth
Core Equity Composite (as of 3/31/25)
In our Core Equity accounts Osterweis has the discretion to decrease or increase equity exposure in an effort to reduce risk.
| QTD | YTD | 1 YR | 3 YR | 5 YR | 7 YR | 10 YR | 15 YR | 20 YR | INCEP (1/1/1993) |
||
|---|---|---|---|---|---|---|---|---|---|---|---|
| Core Equity Composite (gross) | -3.32% | -3.32% | 0.65% | 4.97% | 13.74% | 10.74% | 8.43% | 9.92% | 8.82% | 11.14% | |
| Core Equity Composite (net) | -3.55 | -3.55 | -0.33 | 3.95 | 12.64 | 9.65 | 7.37 | 8.84 | 7.72 | 9.99 | |
| S&P 500 Index | -4.27 | -4.27 | 8.25 | 9.06 | 18.59 | 13.25 | 12.50 | 13.15 | 10.23 | 10.35 | |
Past performance does not guarantee future results.
Rates of return for periods greater than one year are annualized. The information given for these composites is historic and should not be taken as an indication of future performance. Performance returns are presented both before and after the deduction of advisory fees. Account returns are calculated using a time-weighted return method. Account returns reflect the reinvestment of dividends and other income and the deduction of brokerage fees and other commissions, if any, but do not reflect the deduction of certain other expenses such as custodial fees. Monthly composite returns are calculated by weighting account returns by beginning market value. Net returns reflect the deduction of actual advisory fees, which may vary between accounts due to portfolio size, client type, or other factors. From 1/1/2021 onward, net returns also reflect mutual fund fee waivers in certain periods.
The Standard & Poor’s 500 Index (S&P 500) is an unmanaged index and is widely regarded as the standard for measuring U.S. stock market performance. This index does not incur expenses and is not available for investment. Index returns reflect the reinvestment of dividends. The S&P 500 Index data are provided for comparison of the composite’s performance to the performance of the stock market in general. The S&P 500 Index performance is not, however, directly comparable to the composites’ performance because accounts in the composites generally invest by using a portfolio of 30-40 stocks and the S&P 500 Index is an unmanaged index that is widely regarded as the standard for measuring U.S. stock market performance.
The fee schedule is as follows: 1.25% on the first $10 million, 1.00% on the next $15 million up to $25 million, and 0.75% in excess of $25 million. A discounted, institutional rate is available.
Clients invested in separately managed core equity accounts are subject to various risks including potential loss of principal, general market risk, small and medium-sized company risk, foreign securities and emerging markets risk and default risk. For a complete discussion of the risks involved, please see our Form ADV Brochure and refer to Item 8.
The Core Equity Composite includes all fee-paying separately managed accounts that are predominantly invested in equity securities, and for which OCM has the discretion to increase and decrease equity exposure in an effort to reduce risk. The non-equity portion of the account may be invested in cash equivalents, fixed income securities, or mutual funds. Individual account performance will vary from the composite performance due to differences in individual holdings, cash flows, etc.
References to specific companies, market sectors, or investment themes herein do not constitute recommendations to buy or sell any particular securities.
There can be no assurance that any specific security, strategy, or product referenced directly or indirectly in this commentary will be profitable in the future or suitable for your financial circumstances. Due to various factors, including changes to market conditions and/or applicable laws, this content may no longer reflect our current advice or opinion. You should not assume any discussion or information contained herein serves as the receipt of, or as a substitute for, personalized investment advice from Osterweis Capital Management.
Holdings and sector allocations may change at any time due to ongoing portfolio management. You can view complete holdings for a representative account for the Osterweis Core Equity strategy as of the most recent quarter end here.
Small Cap Growth Composite (as of 3/31/25)
| QTD | YTD | 1 YR | 3 YR | 5 YR | 7 YR | 10 YR | 15 YR | INCEP (7/1/2006) |
||
|---|---|---|---|---|---|---|---|---|---|---|
| Small Cap Growth Composite (gross) | -14.58% | -14.58% | -5.89% | 2.92% | 15.07% | 11.38% | 12.32% | 14.57% | 13.34% | |
| Small Cap Growth Composite (net) | -14.78 | -14.78 | -6.78 | 1.97 | 14.00 | 10.33 | 11.24 | 13.46 | 12.24 | |
| Russell 2000 Growth Index | -11.12 | -11.12 | -4.86 | 0.78 | 10.78 | 5.04 | 6.14 | 9.51 | 7.64 | |
Past performance does not guarantee future results.
Rates of return for periods greater than one year are annualized. The information given for this composite is historic and should not be taken as an indication of future performance. Performance returns are presented both before and after the deduction of advisory fees. Portfolio returns are calculated using a time-weighted return method. Portfolio returns reflect the reinvestment of dividends and other income and the deduction of brokerage fees, other commissions if any, and foreign withholding taxes. For the period 10/1/2012-12/31/2015, gross and net portfolio returns reflect the deduction of custodial, administrative, audit, legal, operating, and other expenses. Composite returns are calculated monthly by weighting portfolio returns by the beginning market value. Net return calculation:
A. For the period 7/1/2006-3/31/2014, composite net returns reflect the monthly deduction of an annual model advisory fee of 1.00%:
A1. For the period 7/1/2006-9/30/2012, one or more accounts paid a fee higher than the 1.00% model fee. During this period, the composite net return using the model fee of 1.00% was 10.95%. The composite net return using actual fees paid was 10.61%.
A2. For the period 10/1/2012-3/31/2014, no account in the composite paid a fee higher than the 1.00% model fee.
C. From 1/1/2020 onward, the composite net return is calculated using actual advisory fees, including any applicable mutual fund fee waivers.
D. Our fees may vary between accounts due to portfolio size, client type, or other factors.
Performance for the periods 7/1/2006-9/30/2012 and 10/1/2012-3/31/2016 represents the results of portfolios managed by the investment team while at RS Investment Management Co. LLC and Callinan Asset Management LLC, respectively, and employing the same investment strategy being used at OCM.
The Russell 2000 Growth Index (Russell 2000G) is a market-capitalization-weighted index representing the small cap growth segment of U.S. equities.
Clients invested in separately managed emerging growth accounts are subject to various risks including potential loss of principal, general market risk, small and medium-sized company risk, foreign securities and emerging markets risk and default risk. For a complete discussion of the risks involved, please see our Form ADV Brochure and refer to Item 8.
The Small Cap Growth Composite includes all fee-paying separately managed accounts, limited partnerships, and mutual funds that are predominantly invested in a concentrated selection of the equity securities of small and medium capitalization companies that can rapidly grow revenues and earnings. Portfolios normally remain primarily invested in equity securities except in times of unusual market stress when a more defensive allocation may be deemed prudent. The non-equity portion may be invested in holdings such as cash, cash equivalents, short-term debt securities, mutual funds, and ETFs. The benchmark is the Russell 2000® Growth Index.
References to specific companies, market sectors, or investment themes herein do not constitute recommendations to buy or sell any particular securities.
There can be no assurance that any specific security, strategy, or product referenced directly or indirectly in this commentary will be profitable in the future or suitable for your financial circumstances. Due to various factors, including changes to market conditions and/or applicable laws, this content may no longer reflect our current advice or opinion. You should not assume any discussion or information contained herein serves as the receipt of, or as a substitute for, personalized investment advice from Osterweis Capital Management.
Holdings and sector allocations may change at any time due to ongoing portfolio management. You can view complete holdings for a representative account for the Osterweis Small Cap Growth strategy as of the most recent quarter end here.
The S&P 500 Equal Weight Index is an unmanaged index composed of the stocks held in the S&P 500 Index using an equal-weighted approach instead of market cap-weighted.
These indices do not incur expenses and are not available for investment. The indices include reinvestment of dividends and/or interest.
As of 12/31/23, the Osterweis Core Equity strategy held positions in Amazon, Alphabet, and Microsoft. The Osterweis Emerging Growth strategy does not hold positions in Apple, Amazon, Alphabet, Meta, Microsoft, Nvidia, or Tesla.
Gross profit margin is revenue, less the cost of goods sold (COGS), divided by revenue.
Operating profit margin is calculated by dividing a company’s net income (excluding interest, taxes, and other non-operating costs) by its net sales.
Net profit margin is net income (after COGS, operating expenses, interest, taxes, and other non-operating costs), divided by revenue.
The net debt-to-EBITDA (earnings before interest depreciation and amortization) ratio is a measurement of leverage, calculated as a company’s interest-bearing liabilities minus cash or cash equivalents, divided by its EBITDA.
Price-to-Earnings (P/E) Ratio is the ratio of a company’s stock price to its 12 months’ earnings per share.
Return on equity (ROE) is the amount of net income as a percentage of shareholders’ equity.