Patience Pays: Leaning Into the Inverted Yield Curve
Published on April 12, 2024
We have always maintained it is better to accept what the market has on offer than to stretch for returns. Thanks to the inverted yield curve and our flexible mandate, the current environment is making it easier than ever to be patient while we wait for fat pitches.
The actions of the Federal Reserve, combined with a resilient economy, have created an opportunity in fixed income that is ideal for our unconstrained mandate. We have always attempted to win not only on offense, through careful security selection, but also on defense, by tactically increasing cash when market conditions are unfavorable.
Thanks to the inverted yield curve, our defensive strategy has become part of our offensive playbook. Simply by taking what the market is giving at the short end of the curve, we are able to get paid above the risk-free rate while we wait for opportunities in higher-yielding, longer-maturity bonds. The pressure to stretch for yield — either by sacrificing quality or extending duration — is near an all-time low.
How Did We Get Here?
In the period since the Covid crisis, yield curves and interest rates have re-priced and materially changed the landscape for fixed income investors. At the start of the pandemic, the Federal Reserve aggressively cut interest rates to support the economy. Then, after keeping rates near zero for two years and engaging in quantitative easing, they were compelled to undertake a rapid hiking cycle to combat inflation pressures (which began with Covid-induced supply chain issues and were exacerbated by massive fiscal stimulus programs). Despite calls for/speculation around rate cuts for the past 15 months, the Fed has left its benchmark rate unchanged since June of 2023, which has led to the longest period of an inverted yield curve in over 30 years. The traditional assumption of the inverted yield curve preceding a recession has not yet come to fruition, and in fact, the curve may stay inverted for some time before that happens.
Despite the material tightening of monetary policy, risk assets have performed exceptionally well. As you can see from the charts below, the yield to worst of the ICE BofA U.S. High Yield Index has largely remained flat since the Fed began its rate hikes and has fallen about 185 basis points from its peak in September 2022. Likewise, the yield on investment grade Bloomberg U.S. Corporate Bond Index has remained low and has recently fallen 105 basis points from its peak in October 2023, after rising meaningfully at the beginning of 2022. In addition, the option adjusted spread (OAS) of the investment grade corporate index (not pictured), which measures the spread of each issue in the index versus a risk-free bond of comparable maturity, is currently near the 95th percentile of the last decade. Said another way, over the last ten years, investment grade corporate spreads have been wider than we are now almost 95% of the time. Specifically, during this period, spreads have been only 10 basis points tighter but as much as 280 basis points wider.
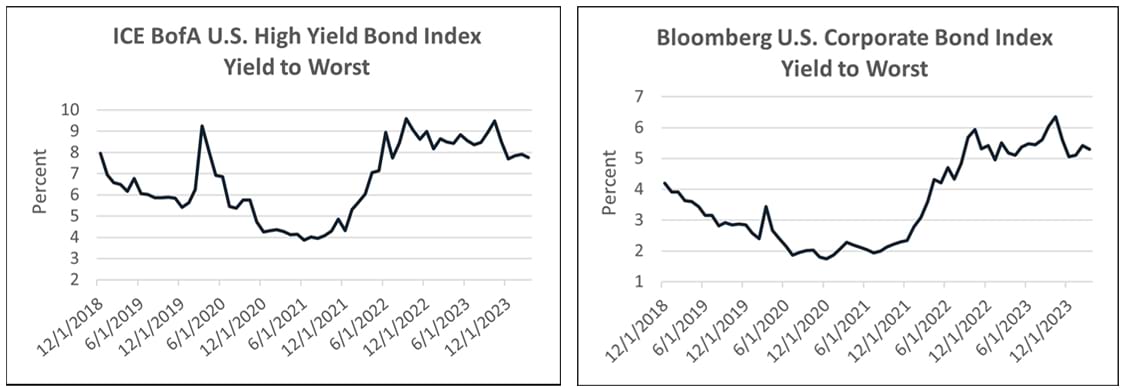
Yields have largely remained flat in both the high yield and investment grade indexes despite the Fed’s tightening program. Source: Bloomberg (as of 3/31/2024).
Cost of Staying Short Is Historically Low
The current environment presents us with two excellent options: 1) selectively investing in longer bonds of good companies with strong yields, or 2) acquiring short-dated instruments that are paying the most attractive levels in over a decade while we wait for even better opportunities. The yield to worst of the high yield index is now 7.75%, which is still attractive relative to the average yield of the past ten years of 6.54%. However, our alternative of investing in high quality short maturity paper has become more attractive by a greater margin. The difference in yield between the ICE BofA U.S. High Yield Index and 3-month T-Bills now sits at 264 basis points, well below the 10-year average of 514 basis points.
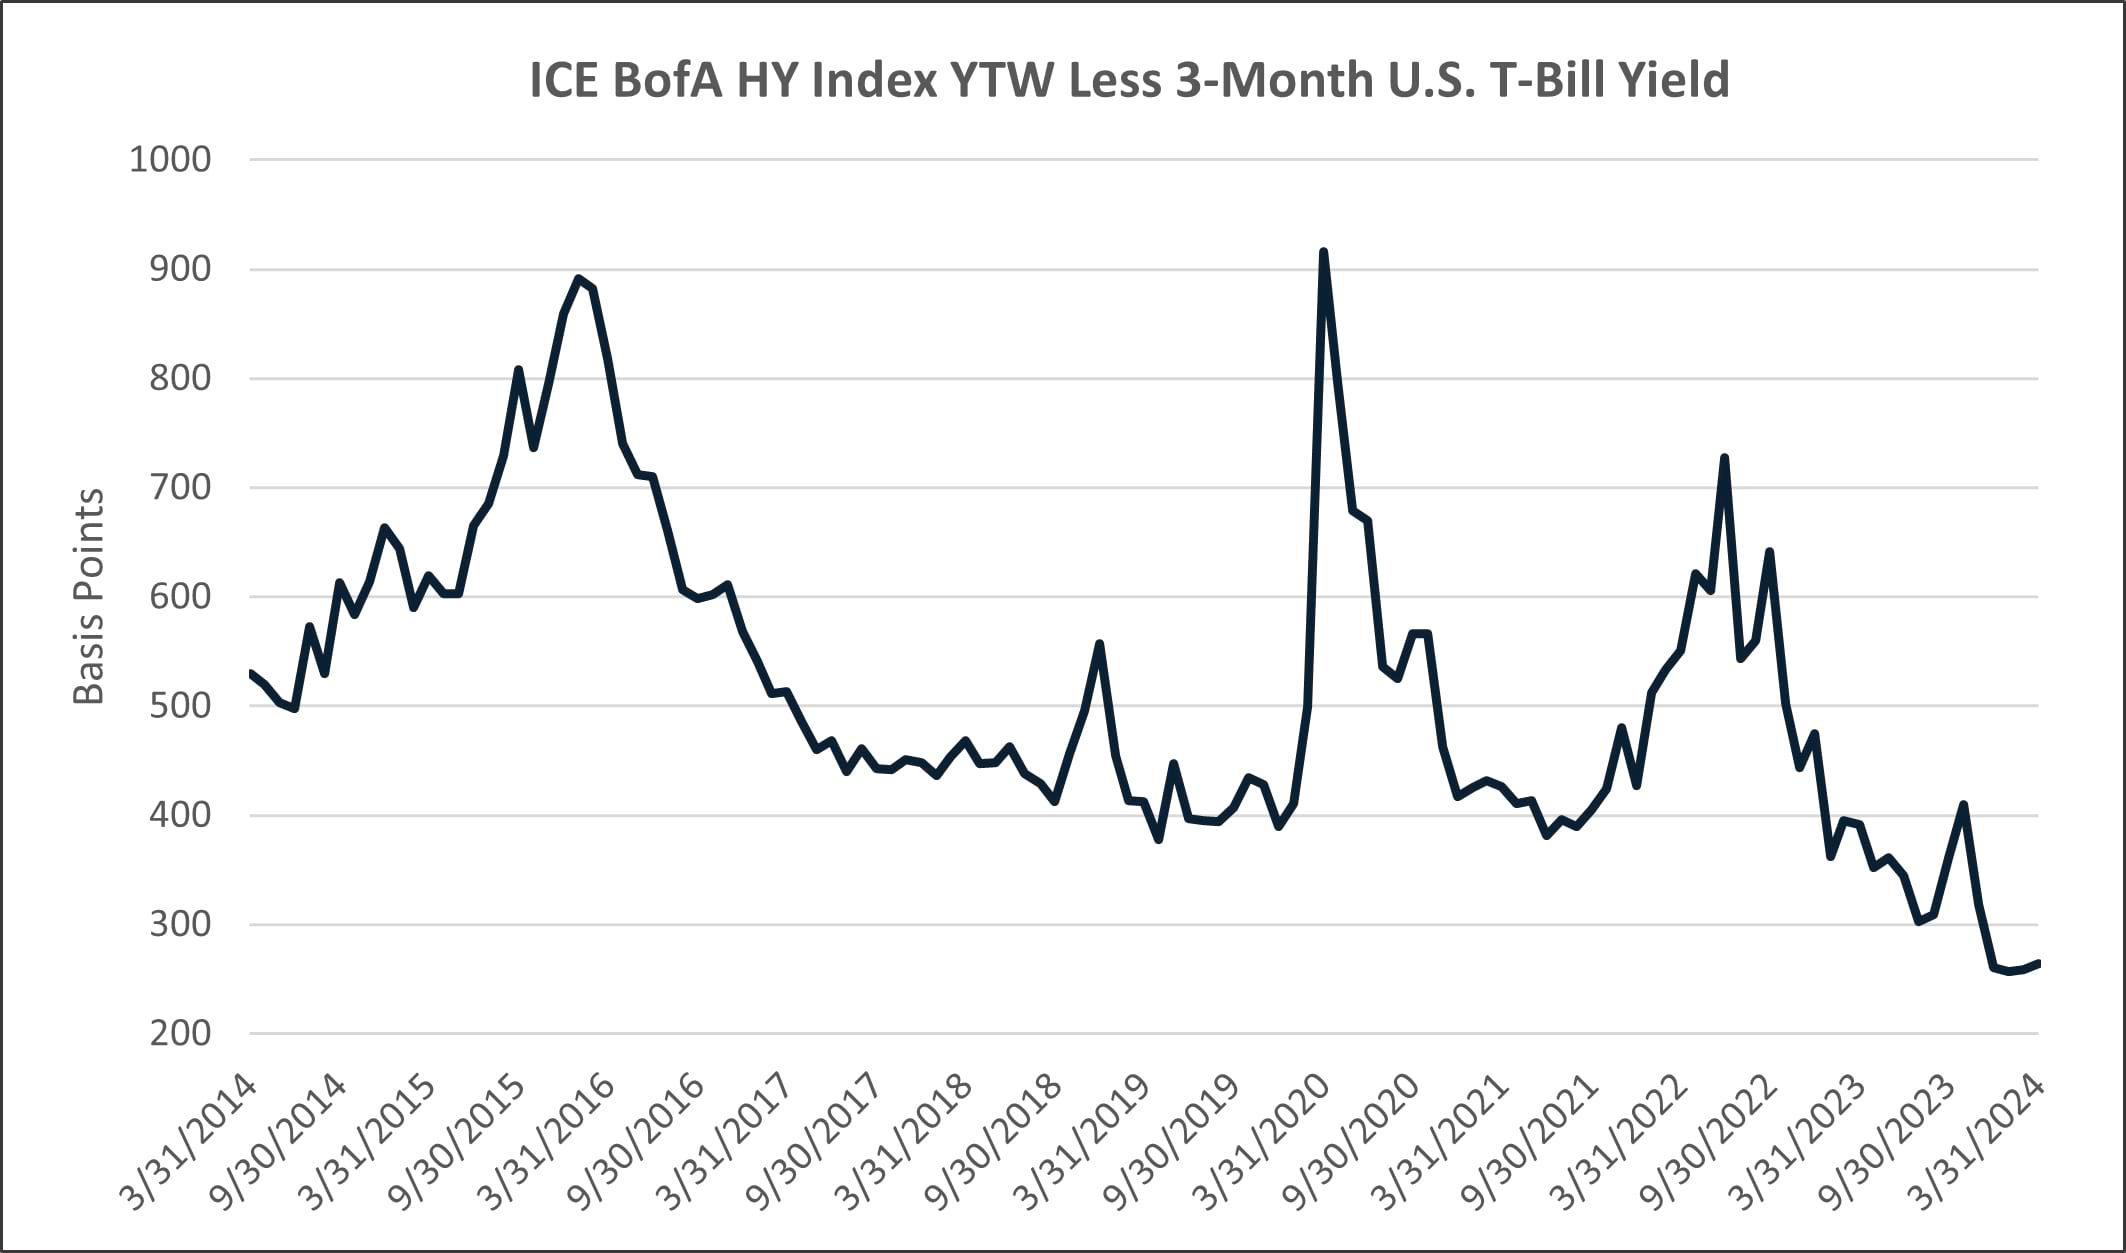
Bond spreads in the ICE BofA U.S. High Yield Index have continued to tighten, but they still pay over 260 basis points more than the 3-month U.S. T-Bill. Source: Bloomberg (as of 3/31/2024).
In summary, the cost of choosing high quality short duration bonds relative to bonds with more duration and/or credit risk is as low as we have ever seen it. The additional benefit of this dynamic is that it allows us to be even more selective in our risk taking. By not chasing riskier bonds or following the herd (into index issues or private equity sponsored deals, for example), we can lay the groundwork for lower volatility in the future. And of course, despite our elevated cash position, the strategy’s returns have substantially outpaced T-Bills as the bulk of our portfolio remains in bonds maturing in two to five years, which has been the key to our strategy’s long-term success.
Final Thoughts
The Osterweis Strategic Income strategy has long used cash (and short-term securities) as a tactical asset. The primary use has been to seek safety when markets have experienced rallies and are priced near perfection. It helps us avoid the temptation of stretching for yield in riskier credits and/or into bonds that provide insufficient risk/reward profiles.
For most of the 15 years following 2008, the return on our cash has been near zero, so it was purely a defensive position intended to help the Strategic Income strategy avoid large losses. Said another way, we were winning by not losing. In this new interest rate regime, cash still helps us play defense, but it is also materially additive to our returns.
Thanks to the inverted curve, we are now sitting in the catbird’s seat — we can be as patient as we like while we wait for fat pitches.
John Sheehan, CFA
Vice President & Portfolio Manager – Strategic Income
This commentary contains the current opinions of the authors as of the date above, which are subject to change at any time, are not guaranteed, and should not be considered investment advice. This commentary has been distributed for informational purposes only and is not a recommendation or offer of any particular security, strategy, or investment product. Information contained herein has been obtained from sources believed to be reliable but is not guaranteed.
The Bloomberg U.S. Aggregate Bond Index (Agg) is widely regarded as the standard for measuring U.S. investment grade bond market performance. This index does not incur expenses and is not available for investment. The index includes reinvestment of dividends and/or interest income.
The Bloomberg U.S. Corporate Investment Grade Bond Index measures the investment grade, fixed-rate, taxable corporate bond market. It includes U.S. dollar-denominated securities publicly issued by U.S. and non-U.S. industrial, utility and financial issuers.
The ICE BofA U.S. High Yield Index tracks the performance of U.S. dollar denominated below-investment grade corporate debt publicly issued in the U.S. domestic market.
{indices_expenses}
Effective 6/30/22, the ICE indices reflect transactions costs. Any ICE index data referenced herein is the property of ICE Data Indices, LLC, its affiliates (“ICE Data”) and/or its Third Party Suppliers and has been licensed for use by Osterweis Capital Management. ICE Data and its Third Party Suppliers accept no liability in connection with its use. See https://www.osterweis.com/glossary for a full copy of the Disclaimer.
A yield curve is a graph that plots bond yields vs. maturities, at a set point in time, assuming the bonds have equal credit quality. In the U.S., the yield curve generally refers to that of Treasuries.
The yield to worst (YTW) is the lowest potential yield that can be received on a bond, assuming there is no default.
Spread is the difference in yield between a risk-free asset such as a Treasury bond and another security with the same maturity but of lesser quality.