Strategic Income Strategy: Built to Withstand Challenging Markets
Published on August 24, 2022
2022 has been a tough year for fixed income, as the Fed tightening cycle, inflation, and recession fears have all weighed heavily on markets. We believe the Osterweis Strategic Income strategy is well-positioned to address these types of challenges, as its flexible mandate and defensive approach help to protect against rising rates and market volatility.
So far, 2022 has not been kind to fixed income investors. Persistent inflation has motivated the Fed to reverse its easy monetary policy, stoking fears of a recession. The Fed has a tough job, trying to cool inflation without causing the economy to slow down too much, and even if they succeed – as we expect – rising rates are likely to dampen fixed income returns for at least the near term. (As rates go up, existing bonds lose value.) Furthermore, weakness in the stock market impacts credit quality, causing spreads to widen and putting additional downward pressure on bond prices.
Despite these headwinds, we believe our Strategic Income strategy is well-positioned, thanks to our flexible mandate and defensive approach. Our shorter duration profile and tactical cash allocation effectively act as shock absorbers, allowing us to outperform during periods of both rising rates and elevated market volatility and to recover more quickly after major drawdowns. In addition, our management team has been through multiple boom/bust cycles over the past twenty years, so we have considerable experience navigating difficult markets.
Low Duration Protects Against Rising Rates
As managing interest rate risk is central to our investment strategy, we typically maintain a low duration profile, which helps mitigate losses during rising rate environments. (Of course, it has the opposite effect when rates fall, but we prefer to sacrifice some upside to increase our downside protection.) Our duration is currently lower than our peers as well as the investment grade Bloomberg Aggregate (the Agg) and the ICE BofA High Yield (ICE HY) indices, as it has been historically.
Additionally, most of our portfolio is invested in non-investment grade bonds, which are generally less sensitive to changes in interest rates than their investment grade (IG) counterparts. We further reduce our duration by investing primarily in issues with shorter maturities, reserving our investments in longer-dated issues for only the most attractive positions.
Our healthy allocation to cash also lowers our overall duration, as does our exposure to convertible bonds, which are less sensitive to rising rates than other types of fixed income securities.
Tactical Cash Allocation Limits Volatility
Our tactical cash allocation does more than reduce our duration – it also dampens our volatility. Bond prices are typically more stable than stock prices, but sudden changes in market sentiment still occur, particularly in non-investment grade debt. Our cash buffer can partly offset fluctuations in the invested portion of the portfolio.
Perhaps more importantly, our cash also provides us with the flexibility to take advantage of market selloffs in real time without disrupting our portfolio. We like to keep an ample supply of “dry powder” on hand, as it allows us to purchase attractive bonds (including convertibles) at discounted prices. Historically, some of our best performing positions have been acquired during periods of market distress. An added benefit of this approach is that it accelerates the recovery timeline once the market begins to stabilize.
Consistent Long-Term Results: Higher Returns, Similar Risk
When we developed the Strategic Income strategy nearly two decades ago, we wanted to provide clients with a fixed income solution that could outperform the Agg over the long term without taking on excessive risk. In our view, we are succeeding. As you can see below, since inception our performance has been roughly halfway between the IG index and the non-IG index (based on net returns).
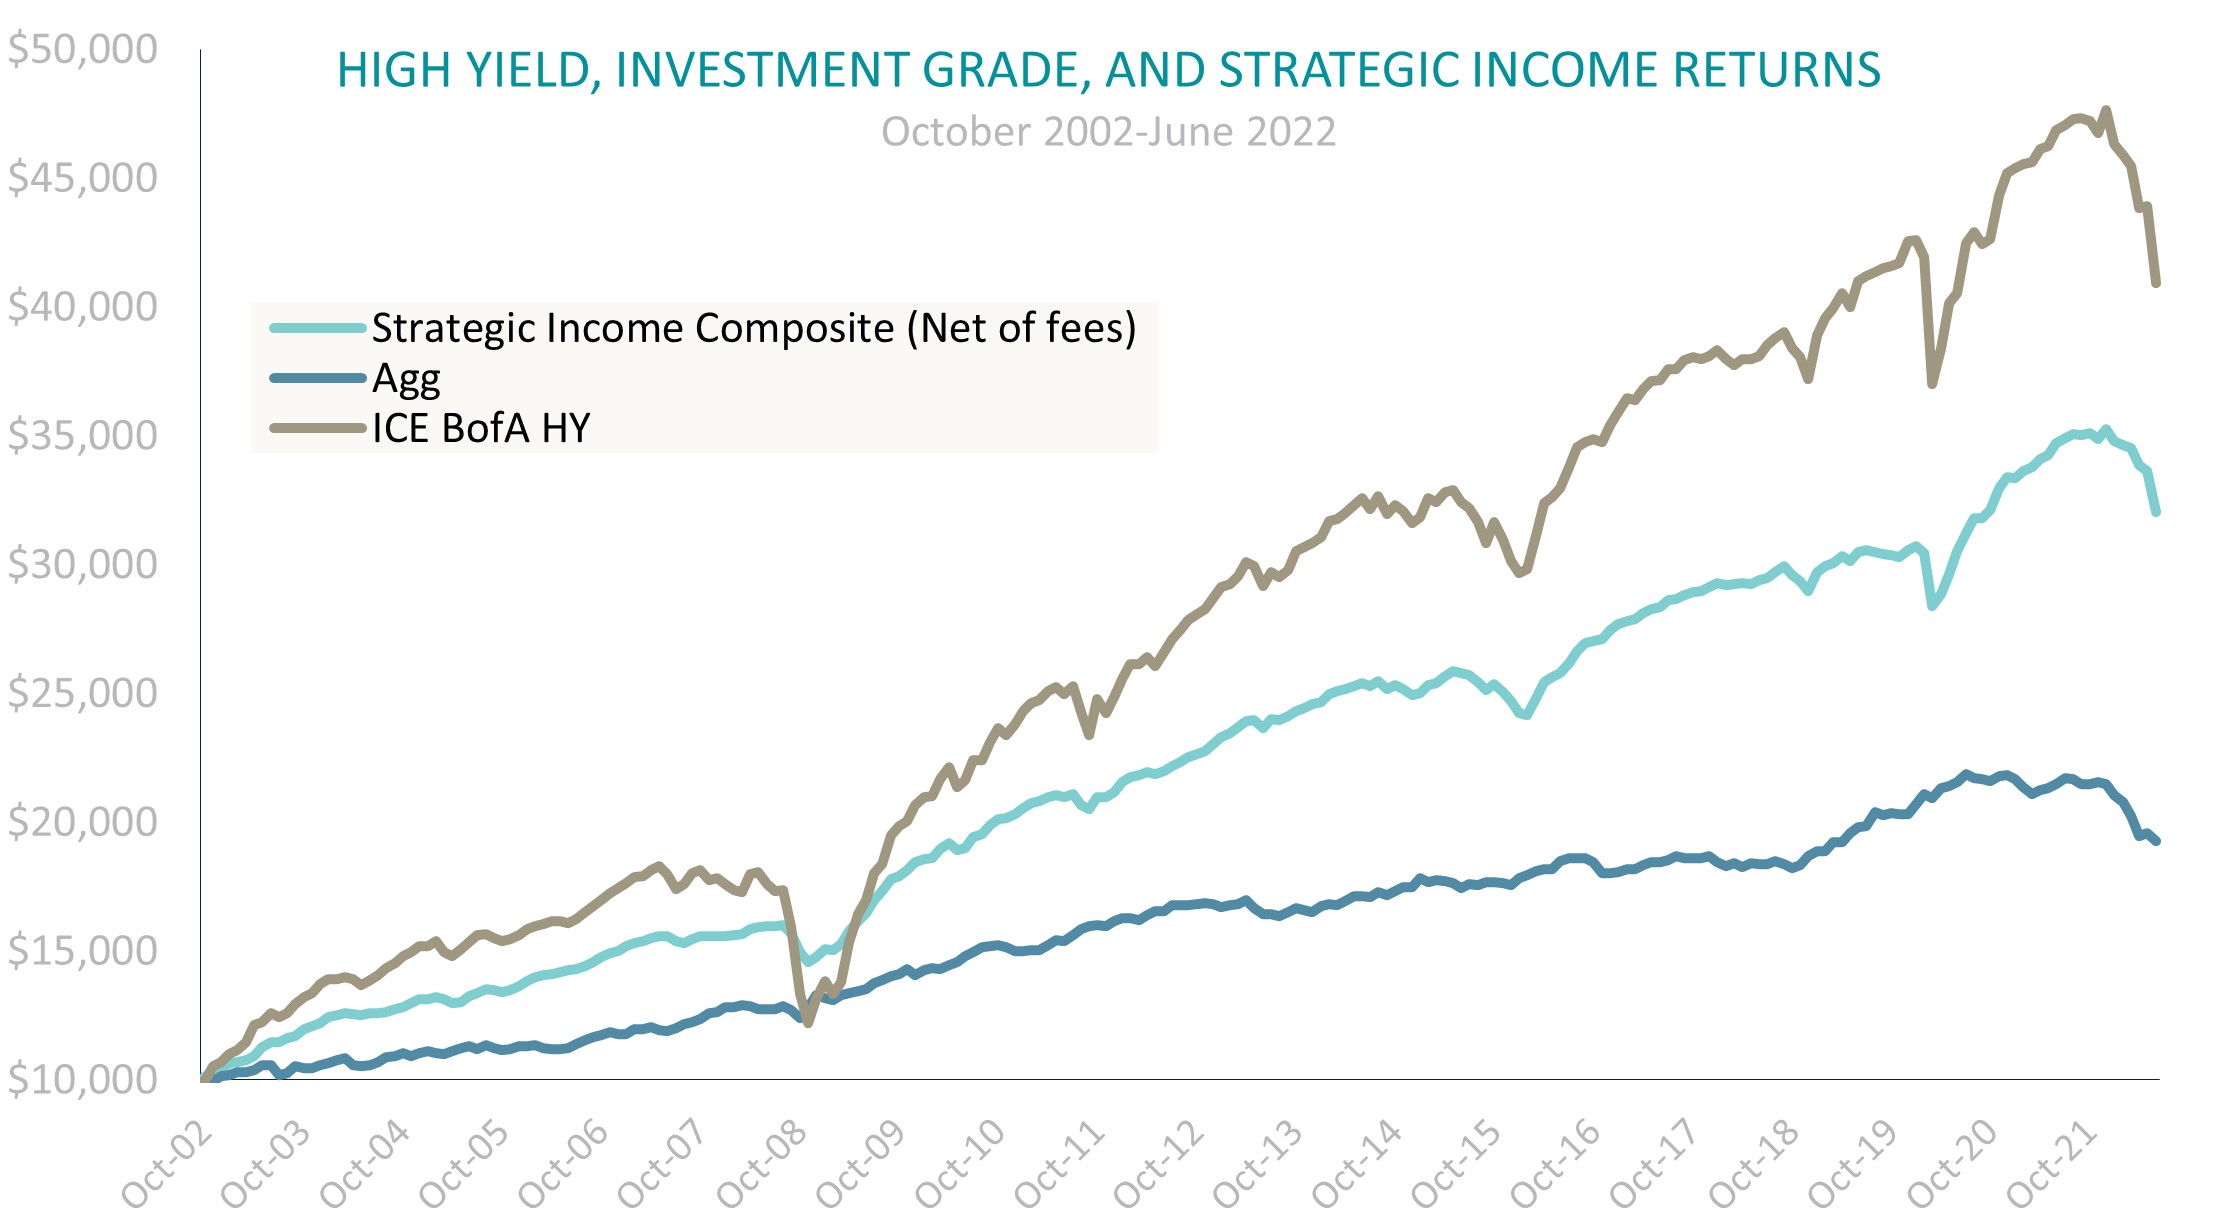
At the same time, our portfolio risk (as measured by volatility) is much closer to the Agg than to the non-IG index, as shown in the table below. In other words, since its inception our strategy has delivered substantially higher risk-adjusted returns than both the IG index and the high yield index.
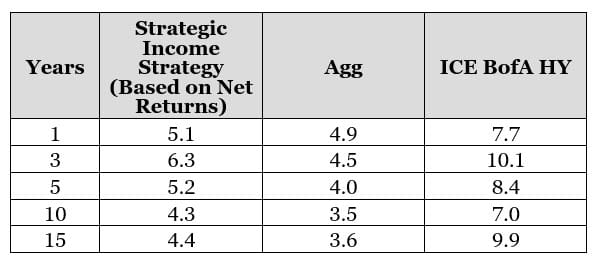
Source: eVestment, data as of 6/30/2022.
Final Thoughts
The current conditions are challenging for fixed income investors, but we believe our Strategic Income strategy is well-positioned to weather them. Our consistent long-term track record and favorable risk/return profile demonstrate our ability to continually adapt to changing markets, and our extensive experience has taught us much about navigating volatile market cycles.
Carl Kaufman
Co-President, Co-Chief Executive Officer, Chief Investment Officer – Strategic Income & Managing Director – Fixed Income
Craig Manchuck
Vice President & Portfolio Manager – Strategic Income
Bradley Kane
Vice President & Portfolio Manager – Strategic Income
Opinions expressed are those of the author, are subject to change at any time, are not guaranteed and should not be considered investment advice.
The Bloomberg U.S. Aggregate Bond Index (the Agg) is an unmanaged index that is widely regarded as a standard for measuring U.S. investment grade bond market performance.
ICE BofA U.S. High Yield Index tracks the performance of U.S. dollar denominated below investment grade corporate debt publicly issued in the U.S. domestic market.
Indices cited do not incur expenses and are not available for investment. These indices reflect the reinvestment of dividends and/or interest.
Source for any Bloomberg index is Bloomberg Index Services Limited. BLOOMBERG® is a trademark and service mark of Bloomberg Finance L.P. and its affiliates (collectively “Bloomberg”). Bloomberg owns all proprietary rights in the Bloomberg Indices. Bloomberg does not approve or endorse this material, or guarantees the accuracy or completeness of any information herein, or makes any warranty, express or implied, as to the results to be obtained therefrom and, to the maximum extent allowed by law, neither shall have any liability or responsibility for injury or damages arising in connection therewith.
Source ICE Data Indices, LLC (“ICE DATA”), is used with permission. ICE DATA, its affiliates and their respective third party suppliers disclaim any and all warranties and representations, express and/or implied, including any warranties of merchantability or fitness for a particular purpose or use, including the indices, index data and any data included in, related to, or derived therefrom. Neither ICE DATA, its affiliates nor their respective third party suppliers shall be subject to any damages or liability with respect to the adequacy, accuracy, timeliness or completeness of the indices or the index data or any component thereof, and the indices and index data and all components thereof are provided on an “as is” basis and your use is at your own risk. ICE DATA, its affiliates and their respective third party suppliers do not sponsor, endorse, or recommend Osterweis Capital Management, or any of its products or services.
Historical returns are provided for informational purposes only, not as an indication of future performance.
Duration measures the sensitivity of a fixed income security’s price (or the aggregate market value of a portfolio of fixed income securities) to changes in interest rates. Fixed income securities with longer durations generally have more volatile prices than those of comparable quality with shorter durations.